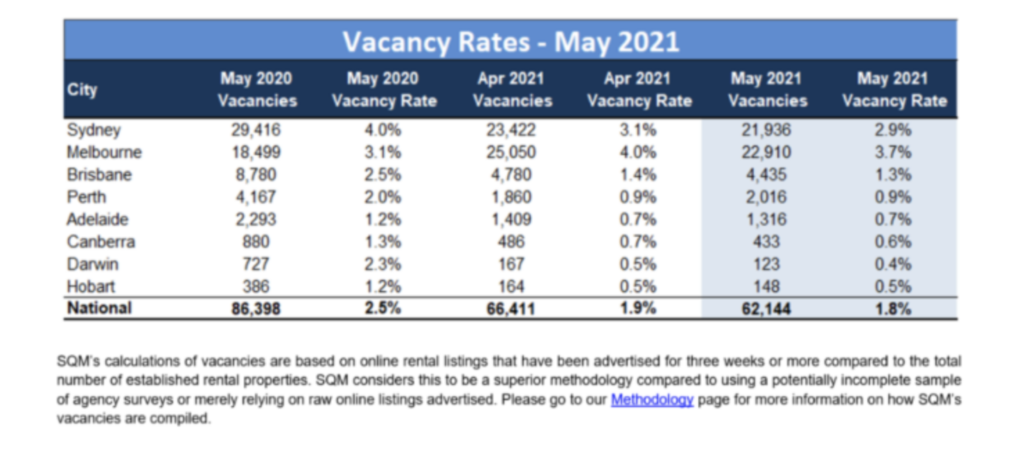
SQM Research has released its rental vacancy report for May, which reports a national rental vacancy rate of only 1.8% – the lowest level of vacancies since October 2012.
Rental vacancies are zipped tight everywhere except Melbourne and Sydney, which have been hit hardest by the loss of international students, as illustrated clearly in the table below.
Rental vacancies are tight everywhere outside of Melbourne and Sydney.
According to SQM Managing Director Louis Christopher, rental vacancy rates have fallen across the board, which has driven rents higher:
“Rental vacancy rates have fallen across the board in May, driving rents higher, especially in regional locations. This trend is likely to remain through the second half of the year, given the fierce competition for rental accommodation in many areas. We are still seeing falling vacancies everywhere from Victoria’s Mornington Peninsula, the Gold Coast, right through to inland areas like the Murray Regions of NSW and South Australia to outback Northern Territory, along with Darwin, which is having the effect of boosting rents as tenants compete for rental homes”.
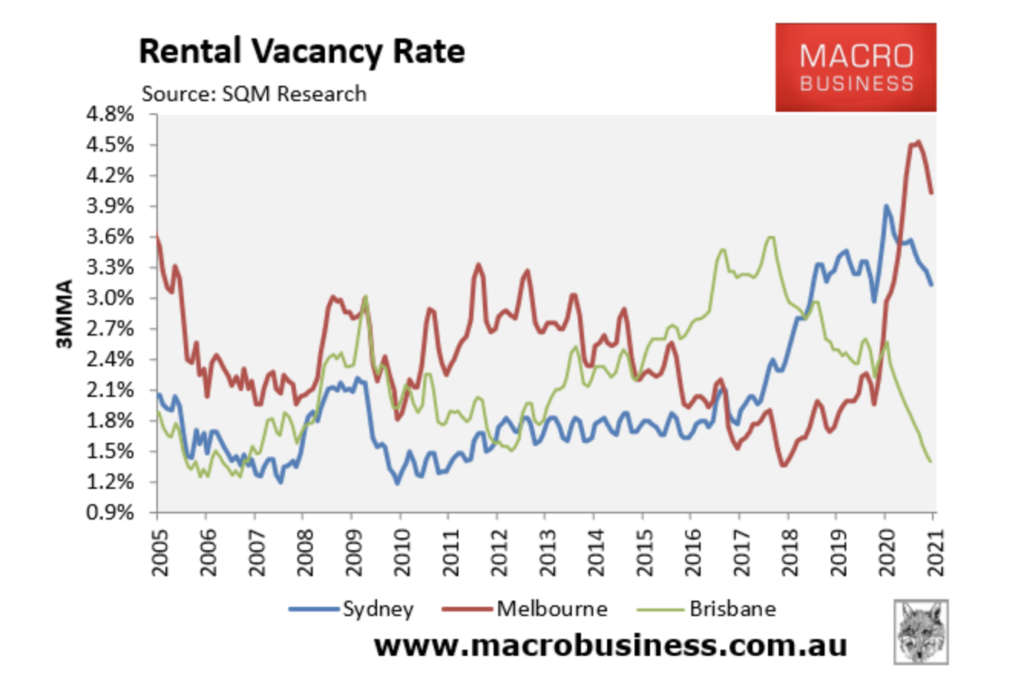
The biggest contrast is seen across the three major east coast cities – Sydney, Melbourne and Brisbane. Brisbane’s rental vacancy rate has shrunk while Melbourne’s and Sydney’s is elevated:
risbane’s rental vacancies have diverged sharply from Melbourne’s and Sydney’s.
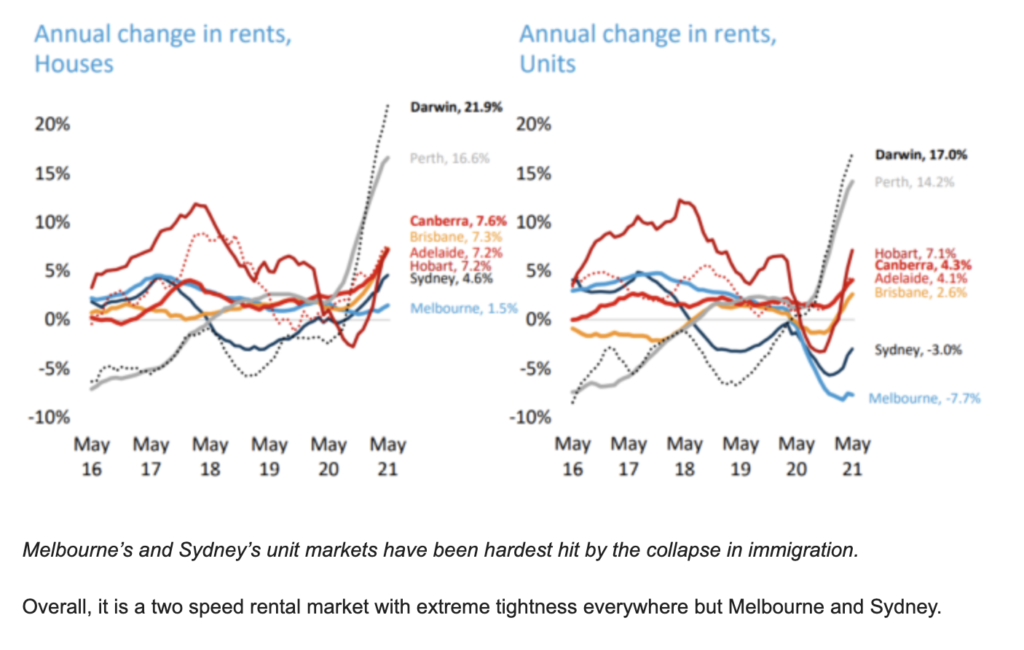
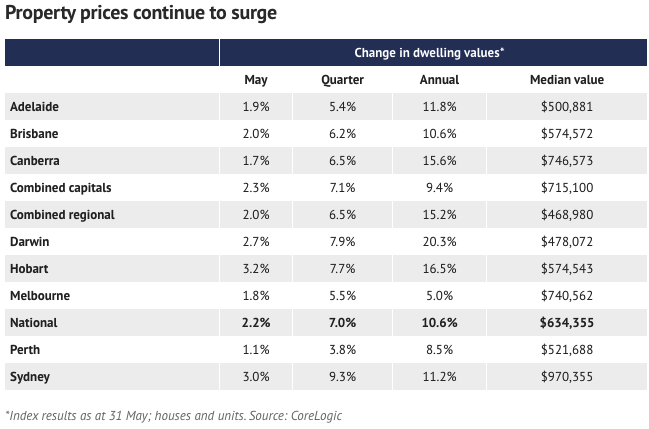
SQM’s rental vacancy data accords with CoreLogic’s latest rental results, which shows strong rental growth outside of Sydney and Melbourne, alongside very strong rental growth nationally:
The eastern Melbourne suburb of Hawthorn is home to some of the nation’s wealthiest residents.
They need to be. The median price for a house in this exclusive enclave is now $2.6 million, having jumped by $200,000 over the past 12 months on CoreLogic figures. Almost all of the homes sold this year in the suburb have achieved seven-figure price tags.
Hawthorn is also the home of federal Treasurer Josh Frydenberg, his wife Amie and their two young children. Pressed this week on whether his children would ever be able to afford to live nearby in their own homes, the usually confident Treasurer could not quite answer.
“We have seen a rise in housing prices but I think that the measures that we have introduced will enable more first-home buyers to get in the market,” he said.
“Obviously, there is both a supply and demand side to this equation. We don’t have the levers … around supply as much as the states do, in terms of land release. But yes, house prices have got up.” He added household assets were five times higher than household debt, ensuring homeowners had the capacity to meet their loan obligations and low interest rates were helping more people get into the market.
CoreLogic data this week confirmed what anyone who owns a home or has endured a Saturday auction already knew – the national property market is on fire.
House values in Sydney jumped 3.5 per cent in May to be 15.1 per cent up since the start of the year. Only the Canadian Pacific coast city of Vancouver has experienced a sharper rise.
It’s barely different in Melbourne, where values lifted another 2.2 per cent last month to be 9.4 per cent up since January 1. Sydney’s median value is now just shy of $1.2 million, climbing by $1220 a day. Melbourne is at $908,000, inching up $770 a day.
That’s just the nation’s two largest property markets. Smaller capitals such as Hobart, Darwin and Canberra have seen an increase in values of more than 11 per cent this year. Darwin values alone are up more than 21 per cent over the past year. Dwelling values have also soared in tree-change country towns and sea-change bolt holes.
While the immediate focus has been on the past year, the last decade illustrates the growing wealth gap between those with a home and those without.
Data compiled by Domain shows that in 2011, about 15.5 per cent of all Sydney homes that year exchanged hands for at least $1 million. So far this year, almost 52 per cent of homes sold in Sydney exceeded the $1 million mark. It’s a similar story in Melbourne, where a decade ago about 10 per cent of homes went for $1 million. So far this year, it’s almost a third.
A global phenomenon
It’s not only Australian home buyers facing a tough market. Property prices around the world are surging on the back of ultra-cheap interest rates and stimulus measures put in place to deal with the coronavirus pandemic.
In the United States, prices have climbed 13.2 per cent in the 12 months to the end of March. The Arizona capital, Phoenix, is leading the way with prices there up by 20 per cent. On the Pacific coast, San Diego prices have jumped by 19.1 per cent.
To the north, prices across Canada jumped 23.1 per cent in the 12 months to the end of April. From Quebec (20.1 per cent) to Vancouver (22.1 per cent), prices are on a tear.
In Britain, it is the regions that are taking off. Prices in Yorkshire (up 14 per cent) and across the north-east (up 13.7 per cent) are soaring compared to London, where they have lifted by a comparatively modest 3.7 per cent.
New Zealand has seen price rises that would make a real estate agent blush. Across a string of provincial areas such as Gisborne, Napier and Palmerston, values have jumped more than 30 per cent over the past year. In the capital Wellington, values have lifted by 23.7 per cent while in the nation’s largest city, Auckland, they have jumped 15.6 per cent.
The explosion in worldwide home prices has rekindled the debate about housing affordability and the potential long-term generational damage.
Australia went into COVID-19 with some of the most expensive capital city dwelling prices in the world and there were already concerns about how low and middle-income earners as well as younger people would be able to buy without relying on the bank of mum and dad. Sydney’s median house price was almost 12 times the median household income while in Melbourne it was close to 10 times. In the late 1990s, they were less than half that.
Property prices are likely to keep roaring higher into further record territory next year, as the Australian economy’s stronger-than-expected recovery continues.
And there is a good chance that they could continue to climb after that, market experts say, albeit prices could start to moderate and even return to their long-term percentage annual growth rates of low, single digits.
Louis Christopher, founder of SQM Research, says there are more property buyers than sellers and with the Reserve Bank of Australia re-affirming interest rates are likely to stay low for a long time, the evidence “suggests the market is going to continue to go up from here; particularly for free-standing houses”.
He estimates the price of free-standing properties in Sydney are up close to 20 per cent in the past year, with similar properties in Melbourne up between 12 per cent and 14 per cent.
“It’s a strong [cities] market and it is also strong in the regions, particularly along the east coast [of Australia],” he says.
After price rises slowed during April of this year, many property market watchers thought that growth would continue to moderate. However, capital city dwelling prices defied expectations and jumped again in May.
Prices in regional areas also climbed, likely driven by those working from home in the wake of the coronavirus pandemic who are seeking a lifestyle change and cheaper housing.
Figures from researcher CoreLogic show dwelling prices in Sydney climbed 3 per cent in May and 11.2 per cent over the 12 months. In Melbourne, prices jumped 1.8 per cent in May and are up 5 per cent for the full year.
Angie Zigomanis, director of Charter Keck Cramer’s research and strategy team, says prices in Sydney and Melbourne could rise by another 10 per cent over the next 12 months.
However, he would not be surprised if it was more like 5 per cent to 7 per cent, given there are so many factors at play; the most obvious being the impact of COVID-19.
Zigomanis forecasts that prices would remain robust for at least 12 months before moderating. He says with Melbourne’s economy traditionally highly dependent on migration growth – not only overseas immigration but also people relocating from other states – the closure of international borders would likely continue to see smaller price rises than in Sydney.
Melbourne’s central-city apartment market is likely to continue to be particularly challenged.
Figures from SQM Research show that although inner-city apartment rental vacancy rates have dipped from their record highs of last year, they remain elevated by historic levels.
SQM Research’s Christopher says the return of property investors to the market could signal that we are now nearer the end of the price-rise cycle than the start.
Usually, price-growth cycles start with first-home buyers, then upgraders join in and, finally, investors come into the market, attracted by the prospects of capital gains, Christopher says.
There is another factor that could help dampen price rises, Christopher says. The Australian Prudential Regulation Authority could “tap the brakes” on home lending, by putting restrictions on lenders. It did that in 2015, continuing the policy until prices peaked in 2017.
Shane Oliver, chief economist at AMP Capital, expects property prices to keep rising until 2023, when we could see the start of another cyclical downturn as interest rates move up more decisively.
Lenders are already starting to increase their 2 and 3 year fixed mortgage interest rates, after earlier increasing their 4 and 5 year fixed rates.
Steve Mickenbecker, Canstar’s group executive financial services, says variable mortgage interest rates are holding firm, but rising fixed rates are a sign that the interest-rate cycle is turning.
Property value growth in Australia’s regional housing market has far outpaced capital cities over the past 12 months, rising 13 per cent compared with a 6.4 per cent gain in capital city values.
CoreLogic’s quarterly Regional Market Update looks at capital growth over the 12 months to April 2021 in Australia’s 25 largest non-capital city markets.
It found the Richmond-Tweed region of northern NSW took the top spot for capital gains across both house and unit markets, with 21.9 per cent and 15.5 per cent annual growth respectively.
Conversely, Bunbury, in Western Australia, was the worst performer across both house and unit markets, with 3 per cent and -4.4 per cent annual growth respectively.
CoreLogic Research Director Tim Lawless said the overall faster pace of growth reflected stronger demand flowing into the regional areas of the country since the onset of COVID.
“This can partly be explained by the new popularity of remote and flexible working arrangements, but also increased demand for lifestyle-oriented properties and holiday homes,” Mr Lawless said.
He added that the comparative affordability of regional markets was “no doubt another incentive”.
“In April, there was a $247,400 difference between the median value of capital city dwellings and regional dwellings,” he said.
“Playing into the lifestyle trend, it’s no surprise to see the Richmond-Tweed area topping the list for capital gains over the past 12 months.
“This region includes high-profile beachside destinations such as Byron Bay, Suffolk Park and Lennox Heads as well as popular hinterland villages such as Bangalow.”
Mr Lawless said the median house value across the Byron council area was $1.4 million, which is higher than Greater Sydney’s median of $1.147 million.
“Looking forward, regional housing markets remain well placed to record higher than average levels of demand,” he said.
“Especially those markets that are located close enough to capital cities to provide a commuting option, and those lifestyle markets that are popular with sea and tree changers.“
Mr Lawless noted that although surging values spelled good news for homeowners it also meant affordability was being stretched for those trying to enter the market.
“Particularly for long-time locals whose incomes are unlikely to be rising at anywhere near the pace of house price appreciation, they may be forced to seek out housing options further afield.”
Despite recording the lowest level of annual growth, Bunbury had the largest change in the number of houses sold across the region, up 51.4 per cent over the year to February 2021.
This was followed by Central Queensland, where house sales increased by 48.4 per cent, and New England and North West in New South Wales (45.1 per cent). Meanwhile, the Launceston and North East region in Tasmania was the only region in this report to see a decline in house sales over the 12 months to February 2021 (-10.1 per cent).
The fastest-selling region for houses over the year to April 2021 was Ballarat, in Victoria, where it is currently averaging 24 days to secure a sale, followed by Newcastle and Lake Macquarie, in NSW, at 26 days, and Illawarra, NSW, at 27 days.
The region with the longest days on market over the year was the NSW’s New England and North West region, where houses are taking 84 days to sell.
Australia’s property boom has picked up pace again, with national housing values rising 2.2 per cent in May, new data shows.
The latest Core Logic Home Value Index, released on Tuesday, revealed the “extreme” results – including rises of more than 3 per cent in Sydney and Hobart in the space of just one month – and a bounce back from April when the market showed early signs of a slow-down.
Corelogic research director Tim Lawless said while the results were not as record-breaking as the peak in March, they were still impressive and spoke to the strength of the boom conditions.
“We’re still seeing it’s not quite as rapid as it was in March, but 2.2 per cent is still extreme especially when you consider wages are rising by 1.5 per cent per annum,” Mr Lawless said.
Median house values were up across all the capital cities, led by Hobart, up 3.2 per cent to $574,543, and Sydney, up 3 per cent to $970,355.
Brisbane was up 2 per cent to a value of $574,572, while Melbourne was up by 1.8 per cent to $740,562. Perth saw the smallest rise of 1.1 per cent, with house values across the city sitting at $521,688.
It was the breadth of the rises that was so significant, Mr Lawless said, noting that they were rising no matter the property type or price segment.
“Values were up by more than 1 per cent across every capital city over the month, with both house and unit values lifting across the board. Of the 334 SA3 sub-regions analysed by CoreLogic, 97 per cent have recorded a lift in housing values over the past three months,” he said.
“Such a synchronised upswing is an absolute rarity across Australia’s diverse array of housing markets.”
While Sydney’s growth continued to stun the property sector, other regions throughout the country were seeing unprecedented rises.
“Although housing values are now rising the fastest once again in Sydney, at least in trend terms, the annual growth rate is generally higher across the smaller capitals, as well as regional New South Wales and regional Tasmania,” Mr Lawless said.
Darwin cracked the 20 per cent annual growth barrier in May, Mr Lawless said, with house values now 20.3 per cent higher over the past 12 months.
“For Darwin dwellings, this is the strongest annual gain on record,” he said.
Housing values across all of regional New South Wales were up 18.6 per cent while regional Tasmania values were 18.1 per cent across the year.
The rise in values in regional NSW had been led by the Richmond Valley Coastal area – including Byron Bay – which has seen a 31.5 per cent rise in house values over the past 12 months, Mr Lawless said. Likewise, the west coast of Tasmania, including Queenstown and Strahan, saw values rise by 25.1 per cent over the past year,
A better lifestyle and working from home had both played big parts in seeing people move to regional areas after the worst of COVID-19 – as had housing affordability, though it was becoming far more expensive to buy a home in some regional areas.
“There’s little difference between house prices in Byron Bay and Sydney,” Mr Lawless said.
Though some regional areas flew, others did not do as well. The weaker part of the market over the past year included regional Western Australia, where values remained the same.
Melbourne, which had a value rise of just 5 per cent over the past year, had suffered the effects of the extended lockdown, Mr Lawless said. He added that it was too early to tell whether the latest lockdown would have any significant effect on housing values.
While the housing boom continued in May, there would be some challenges to its continued growth at pace.
“We expect to see a gradual tapering in the pace of growth, and affordability will be behind that, adding to the slow-down,” Mr Lawless said.
The building of more dwellings would ease the current supply and demand issues, and a slow rise in fixed-term interest rates could also have an impact.
“There won’t be a sharp downturn until there’s a significant catalyst like interest rate rises, and the speculation is that won’t happen until at least 2024,” Mr Lawless said.
When the pandemic first arrived on our shores back in March last year, the mood within the property market rapidly deteriorated.
In just weeks, a bullish market had been flipped on its head, with widespread reports of properties being sold for significantly below asking prices.
Then came the predictions of big losses for property owners, as housing analysts and the banks fired off forecasts of up to 32 per cent price falls in quick succession.
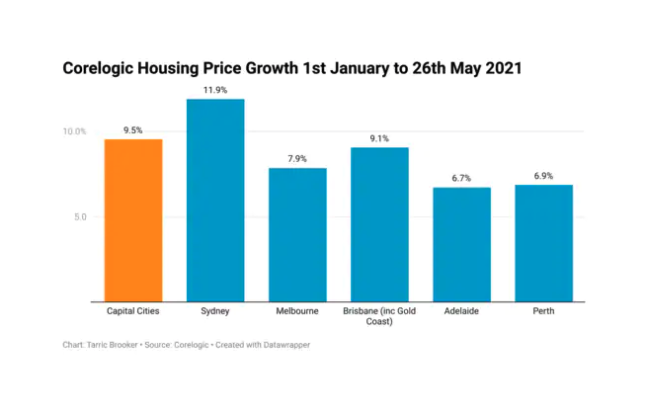
Now as we look back at those market conditions through the lens of prices rising at the fastest rate since the late 1980s, March 2020 seems like a completely different world.
Since the start of the year, property prices in the nation’s five largest capital cities have risen by a whopping 9.5 per cent, with Sydney leading the way with prices rising by 11.9 per cent.
But as some of these lucky Australians enjoy their large capital gains, for those who don’t own their own home, things are quite a bit different.
According to a report from Domain, potential homebuyers have seen the required size of home deposits skyrocket since the start of the year.
“Anyone in Sydney who had saved a 20 per cent deposit on the median house price in December but did not manage to buy a home needs to have saved an extra $20,614 since then (to March 31st) to keep their deposit at 20 per cent of the current median house price.”
While Sydney is certainly an outlier, between January 1 and March 31, the required deposit (20 per cent) to buy a median house rose by $9706.
It’s important to keep in mind that these required savings actually get prospective home buyers no closer to their dream of property ownership than they were before. Instead, they merely maintain the purchasing power their deposits had previously before prices took off.
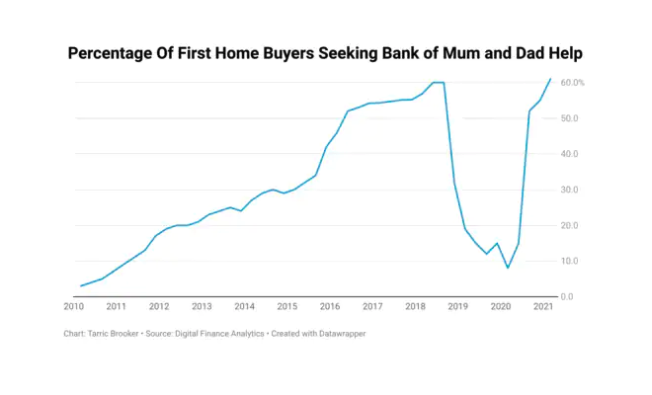
As prices continued to get away from prospective first homebuyers, many looked to their parents for help getting into the market.
According to figures from research firm Digital Finance Analytics (DFA), the number of first home buyers seeking help from their parents rose from 8 per cent in the first quarter of last year, to more than 60 per cent by March 2021.
The average assistance being provided isn’t exactly just parents providing a bit of a top up to their adult children’s deposit either.
As of March, the average amount of assistance parents were providing their first homebuyer children for their deposits was almost $90,000.
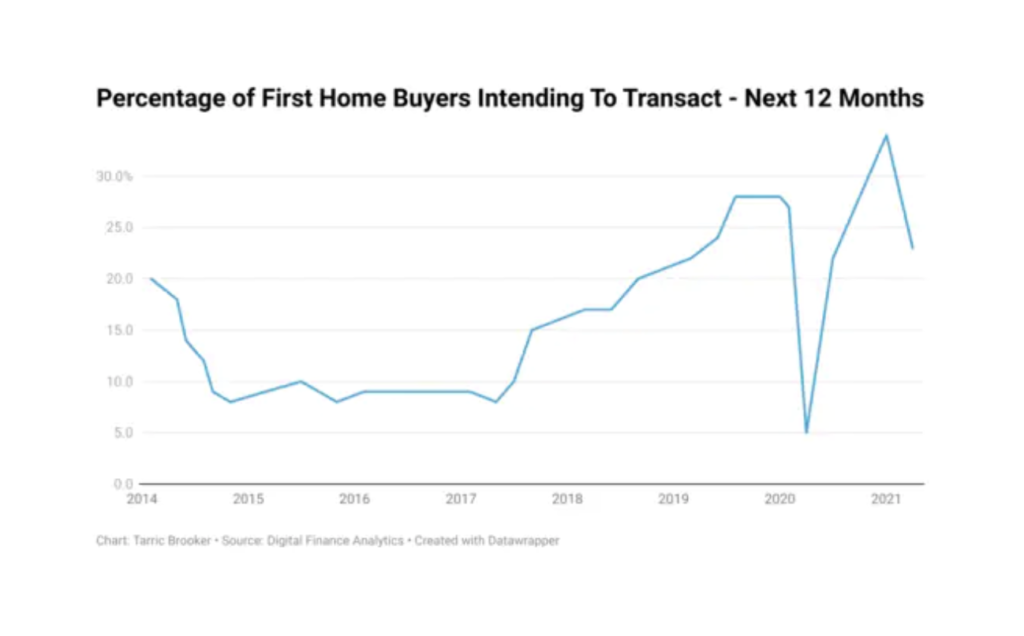
Despite a relatively strong increase in prices up until the end of the last year, first home buyers were generally undeterred by this additional hurdle to get into the market.
Figures from DFA show that a record high 34 per cent of prospective first home buyers were looking to get into the market in the next 12 months at the start of this year.
This has since fallen to 23 per cent in the largest one month non-Covid related move in the index since records began in 2013.
With deposit requirements setting off for the stratosphere and prices rocketing out of the reach of many prospective first home buyers, it’s perhaps unsurprising that so many have chosen to give up on trying to buy a home, at least for now.
In decades long past, this may have started to put the brakes on a housing boom, as prospective buyers leave the market and price growth begins to slow down as a result.
In the United States, rising prices have already resulted in the single largest monthly drop in home buying intentions in the 54 years records have been kept.
But like the theme of so many finance industry presentations and backyard BBQ conversations, Australia really is different.
Through the forces of negative gearing and a growing perception that the government will not allow prices to fall significantly, we may be seeing only the first stage of the rocket that is the nation’s current property price boom.
“They [the federal government] will never let a housing crash happen in this country.”
As the number of first home buyers priced out of the market continues to rise, the capital gains potentially on offer has seen the number of investors looking to get into the market or buy more properties has set off like a rocket.
When surveyed in January, few property investors were looking to transact, with just 1 per cent of those DFA defines as “portfolio investors” stating they intended to buy in the next 12 months.
By the time April came around, the situation had been completely transformed by the hottest property market since the late 1980s.
In April, 16 per cent of solo investors and 21 per cent of portfolio were now suddenly looking to get into the market.
To put these figures into perspective without the distortions from the pandemic, in February 2020 just 7 per cent of solo investors and 14 per cent of portfolio investors were intending to buy a property in the next 12 months.
While rocketing prices are disastrous for first home buyers who increasingly find themselves priced out of the market in greater and greater numbers, for property investors, rising prices are having completely the opposite effect.
Rising prices are an incentive to get into the market, to take advantage of what they hope will be yet another long-term period of very strong housing price growth.
Where the housing market will find itself in the long term is anyone’s guess, as concerning signs of weakness begin to emerge in the global economic recovery.
But in the short term, there are two things we know with relative certainty.
Investors will likely once again get into the market to chase capital growth, in what is perceived as the nation’s safest asset, and first home buyers will continue to be priced out of the market.
House prices could rise more than 10 times faster than wages this year, with a top economist warning that the improving jobs market will make little difference to modest income earners trying to save a house deposit.
And experts warn that government grants to home buyers and tax incentives for investors will only make it harder for some to buy a home.
The odds are stacked against lawmakers’ attempts to improve the cost of housing, with the millions of home-owning households – who do not wish to see the value of their asset fall – dwarfing the roughly 100,000 first-home buyers every year.
Australia’s job market has improved since the depths of the pandemic recession, with the unemployment rate dropping 0.2 percentage points to 5.5 per cent in April, on ABS figures released last week.
Wages edged up 0.6 per cent in the March quarter, tracking at an annual growth rate of 1.5 per cent.
But with house prices growing more than eight times that pace in the same period alone, Shane Oliver, chief economist of AMP Capital, said it does not come close to helping aspirational home owners into the market.
“It hardly makes any difference. House prices are up 8 per cent already this year based on CoreLogic numbers. There’s another 2 per cent coming in May alone,” Dr Oliver said. “As this year settles down, we’re going to see house price growth at 15 or 20 per cent in some cities.”
New CoreLogic data has revealed that the value of properties in regional Australia grew at twice the pace of capital cities in the last 12 months.
CoreLogic’s quarterly Regional Market Update showed that the regional housing market surged by 13.0 per cent in the last 12 months, compared with a 6.4 per cent rise in capital city values.
The update – which explored capital growth over the last 12 months to April 2021 in Australia’s 25 largest non-capital city markets – revealed that while growth rates varied across the regional housing market, housing values grew in all the regions included in the CoreLogic report over the year to April 2021.
Across the regional house market, the Richmond – Tweed region in northern NSW recorded the highest yearly growth rate of 21.9 per cent in April 2021, while the Bunbury region in Western Australia recorded the lowest yearly growth rate of 3.0 per cent, the data showed.
It also showed that Bunbury registered the largest change in the number of houses sold across the region, up 51.4 per cent over the year to February 2021, followed by central Queensland (up 48.4 per cent) and New England and North West in NSW (up 45.1 per cent).
However, the Launceston and North East region in Tasmania was the only region in the report to record a decline in house sales, down 10.1 per cent over the 12 months to February 2021.
The quickest-selling region for houses over the year to April 2021 was Ballarat in Victoria, where it is currently averaging 24 days to secure a sale, followed by Newcastle and Lake Macquarie in NSW (26 days), and Illawarra, NSW (27 days), according to CoreLogic.https://5710bd6eb16164cee9c60aa6a15b3d24.safeframe.googlesyndication.com/safeframe/1-0-38/html/container.html
On the other hand, it is taking around 84 days to sell a house in New England and North West region, making the region with the longest days on market.
The Hume region in Victoria is offering the lowest discount to secure a sale (a discount of 2.3 per cent), while vendors in Townsville, Queensland, are offering the highest discount rate of 5.4 per cent to secure a sale, the report said.
Across the regional unit market, the Richmond – Tweed region recorded an annual growth of 15.5 per cent in April 2021, while the Bunbury region also recorded the lowest yearly unit value growth, with unit values down 4.4 per cent, making it the only region to record a decline in unit values over the year to April 2021.
The report also said that sales volumes for units increased by 76.0 per cent across central Queensland over the year to February 2021, while sales volumes decreased by 27.9 per cent across the Launceston and North East region in Tasmania.
The only other regions to record a decline in unit sales volumes over this period were Hume, Victoria (down 5.4 per cent), Cairns, Queensland (down 4.4 per cent), and Ballarat, Victoria (down 1.8 per cent).
According to CoreLogic’s report, it is taking around 92 days to sell units across central Queensland, pointing to challenging selling conditions.
Meanwhile, the Launceston and North East region currently sell quicker than any other region, with the median time on market sitting at 24 days over the year to April, followed by Ballarat (27 days) and Illawarra, NSW (34 days).
The data also showed that the Townsville region is offering the largest discounts to secure a sale (discount of 6.5 per cent), while Ballarat is offering discounts of 1.8 per cent, making it the region with the lowest discounts.
Commenting on the regional housing market outpacing capital cities, CoreLogic research director Tim Lawless said that it reflected stronger demand for regional housing through the coronavirus pandemic period to date.
He said: “This can partly be explained by the new popularity of remote and flexible working arrangements, but also increased demand for lifestyle-oriented properties and holiday homes.”
He also noted that in April, there was a $247,400 difference between the median value of capital city dwellings and regional dwellings.
“No doubt the more affordable housing options across many of Australia’s regional markets is another incentive,” he said.
Mr Lawless also said he was not surprised that the data showed that the Richmond – Tweed area topped the list for capital gains over the past 12 months.
“This region includes high-profile beachside destinations such as Byron Bay, Suffolk Park and Lennox Heads as well as popular hinterland villages such a Bangalow,” he said, adding that the median house values across the Byron council area is now $1.4 million, exceeding the median value of $1.147 million in greater Sydney.
Looking forward, Mr Lawless said that regional housing markets remain poised to record higher than average levels of demand, especially those markets that are close enough to capital cities to provide an easier commute option, as well as those lifestyle markets popular with sea and tree changers.
He concluded: “While surging values are probably good news for home owners in these regions, for those that don’t own a home, affordability is being stretched.
“Particularly for long-time locals whose incomes are unlikely to be rising at anywhere near the pace of house price appreciation, they may be forced to seek out housing options further afield.”
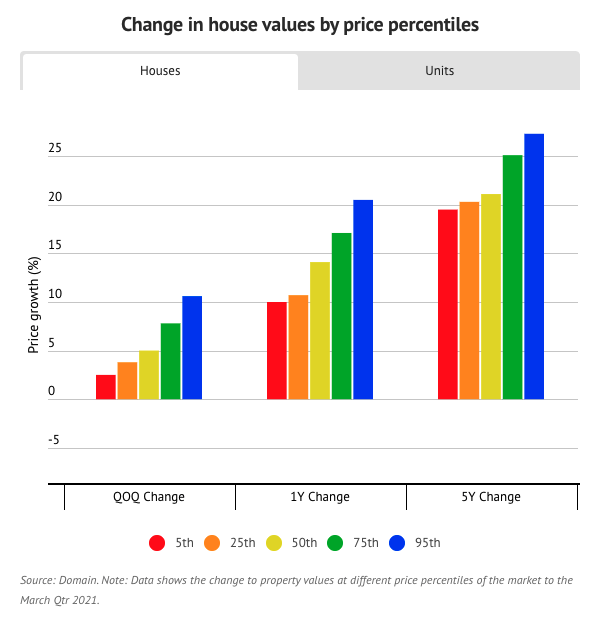
Sydney’s prestige home prices are rising at twice the rate of cheaper properties, new data shows, but even entry level homes are seeing rapid gains.
Prices for the most expensive houses jumped 10.6 per cent over the first three months of the year alone, Domain figures show, increasing twice as fast as the middle of the market and four times as fast as the cost of the most affordable homes.
The figures — which break down home value growth by price percentile — show values at the very top of the market, the 95th percentile, climbed $350,000 in the March quarter to a peak of $3.65 million. They’re now up 20.5 per cent, or $620,000, in the past year.
A house hunter with that budget could afford to buy a median-priced house in the likes of Killara on the upper north shore, Clovelly in the eastern suburbs and Manly on the northern beaches.
Domain senior research analyst Nicola Powell said high-end homes were leading the charge in Sydney’s rapidly rising market, which recorded its steepest house price growth in almost three decades in the March quarter.
“Prices are accelerating faster at the upper end followed by the mid-point of the market,” she said, adding that the strongest quarterly gains had been recorded in the eastern suburbs and northern beaches.
House prices for the mid-market climbed 5 per cent in the March quarter, while the affordable end of the market, the 5th percentile, increased 2.5 per cent.
Annually, mid-priced houses are up 14.1 per cent to a new peak of $1.05 million, while the cheapest houses are up 10 per cent to a record $528,000.
“The top end of the market in any micro-market across Sydney is what is performing best,” said Thomas McGlynn, head of sales at BresicWhitney.
“This is probably representative of the fact of higher socioeconomic classes have come out of COVID with quite remarkable financial returns on investments and business performance.”
Higher-income earners had more scope to increase their budgets, which in turn pushed prices up faster, Mr McGlynn said. Low interest rates and strong demand for larger homes as people work remotely were also fuelling rapid price gains.
Matthew Hayson, director of Cobden & Hayson, said agents were being inundated with buyers who wanted a larger lifestyle home, in short supply in markets such as Balmain and Rozelle.
“We’ve just been involved in five sales this week where [properties] are just making numbers that do not make sense, we’re … nearing $5 million in Balmain for fairly standard terraces, which a year ago would have been lucky to make $3 million,” he said.
Mr Hayson said there was strong demand from professionals, who fared better than expected financially over the past year, and were prepared to spend big — making the most of cheap credit and increased savings, bolstered by less spending on overseas travel and other discretionary expenses.
Mr Hayson expected the Sydney property market could peak this quarter, with fixed-term interest rate hikes by the banks likely to ease demand.
A pullback by some buyers could also ease the strong competition for high-end homes, with Mr Hayson noting some buyers armed with budgets of $5-6 million were finding they could no longer get into the local prestige market and were deciding to “sit this one out”.
Longer term, growth in affordable house prices has been at a closer pace to the top end of town, at 20 per cent and 27 per cent, respectively, over the past five years.
The only suburbs that recorded a median house price below the 5th percentile in the latest Domain House Price Report were Whalan, Box Hill and Airds — all more than 40 kilometres west of the city centre.
It was a different story for the city’s unit market. Sydney’s most affordable apartment price bracket comes in at $385,000 — $5000 cheaper than it was five years ago.
The middle of the market was up about 2 per cent over the five-year period, while high-end apartments were up about 14 per cent to $1,885,000.
The top of the market was the only segment to record annual unit price growth, of just 1.6 per cent, with all other price points down or steady over the year.
This was echoed by Mr Hayson, who said apartment prices were starting to pull back up, and that more first-home buyers were having to turn to the bank of mum and dad to keep up with rapid price growth.
The Australian dwelling market has reached a new record high, with the total value of residential real estate breaking the $8 trillion mark for the first time.
Following recent broad-based capital gains across the country, with many markets said to be at their peak, residential real estate now makes up the bulk of Australia’s wealth, CoreLogic data has revealed
According to the data, Australia now boasts 10.6 million dwellings worth $8.1 trillion.
“This puts Australian residential property at around four times the size of Australian GDP, and around $1 trillion more than the combined value of the ASX, superannuation and commercial real estate stock,” said CoreLogic’s head of research, Eliza Owen.
As such, an average 53 per cent of household wealth is held in housing.
The growth in housing value is underpinned by the 6.8 per cent property price increase recorded in the three months to April – the highest quarterly growth in more than 30 years. Individually, every capital city recorded a rapid rate of appreciation in home values, ranging from a quarterly rise of 8.8 per cent in Sydney to 4.2 per cent in Perth.
Overall, dwelling values in Australia are 7.8 per cent higher over the year, and currently sit around 7.6 per cent above the previous October 2017 record high.
This strong increase in the value of residential real estate has put Australian home owners in a strong equity position, with the Reserve Bank of Australia (RBA) estimating just 1.3 per cent of housing loans were in a negative equity position at the start of the year.
First home buyers, however, are said to be facing greater affordability constraints, with finance acquired by first-timers, as a portion of lending to owner-occupiers, down nationally to 30.4 per cent.
“For many Australians looking to get a foot on the property ladder, the continued strength in the market is putting home ownership further out of reach despite record-low mortgage rates,” Ms Owen said.
“Wages growth simply isn’t keeping pace,” she highlighted.
While alternative purchasing methods are on the rise, including ‘rent-vesting’, ‘the bank of mum and dad’ and ‘fractional investing’, Ms Owen believes first home buyer numbers are set to keep declining in 2021.
Overall, CoreLogic’s data shows a growth in sales volumes of 22.6 per cent nationally over the 12 months to April. Regional growth is said to be at 34.0 per cent, while capital cities saw a cumulative increase of 16.1 per cent.
As for rents, national values have risen 4.9 per cent in the year to April, following a long period of subdued rental conditions, and a fall in rents at the onset of COVID-19. Darwin led the rental charge with growth of 18.0 per cent, followed by Perth on 15.7 per cent.
According to CoreLogic, with housing values generally outperforming rents, yields are trending lower, with the exception of Perth and Darwin.
Currently, the biggest problem for the real estate market is a lack of volume, but CoreLogic has reported a substantial increase in fresh listings to the market through April, with the figure said to be 18.3 per cent above the five-year average level for this time of year.